Grafana 설치 & Prometheus 연동하기
Grafana 설치 & Prometheus 연동하기
Helm 차트를 이용하여 Grafana를 설치하는 방법에 대해 알아보겠습니다. (Docker Desktop에서 구성한 Kubernetes 환경에 설치한 내용을 정리했습니다)
1. Grafana 구성
Grafana는 시계열 데이터 시각화를 위한 오픈소스 툴킷입니다. 리소스의 메트릭이나 로그 정보를 시각화하는데에 많이 사용합니다. 특징을 간단하게 정리하면 다음과 같습니다.
- 데이터 통합 및 변환
백엔드 저장소나 데이터베이스에 종속적이지 않고 동적으로 데이터를 수집하여 시각화.
서로 다른 쿼리와 데이터 소스에 대해 다양한 연산 수행 기능 지원. - 다양한 플러그인 지원
실시간 렌더링이 가능한 다양한 데이터 소스 플러그인을 지원 - 알림 지원
시각화한 UI에서 알림 및 관리 기능 지원 - 대시보드 커스터마이징
Grafana: The open observability platform
Play around with the Grafana Stack Experience Grafana for yourself, no registration or installation needed.
grafana.com
2. Grafana 설치
2.1. Helm을 이용한 Grafana 설치
Grafana 설치를 위해 Helm Repository를 추가해줍니다.
$ helm repo add grafana https://grafana.github.io/helm-charts
Grafana Helm Chart를 다운로드 해줍니다.
$ git clone https://github.com/grafana/helm-charts.git
values.yaml 파일이 있는 위치로 이동해줍니다.
$ cd helm-charts/charts/grafana
values.yaml 파일을 열어서 Web UI에서 사용할 admin 계정을 설정해줍니다.
$ vi values.yaml

...

# Administrator credentials when not using an existing secret (see below)
adminUser: admin
adminPassword: ${adminPassword}

...
다음으로 서비스를 브라우저에서 확인하기 위해 ClusterIP를 NodePort로 변경해주고 nodePort를 지정해줍니다.
$ vi values.yaml

...

## Expose the grafana service to be accessed from outside the cluster (LoadBalancer service).
## or access it from within the cluster (ClusterIP service). Set the service type and the port to serve it.
## ref: http://kubernetes.io/docs/user-guide/services/
##
service:
  enabled: true
  #type: ClusterIP
  type: NodePort
  port: 80
  targetPort: 3000
  nodePort: 31030
    # targetPort: 4181 To be used with a proxy extraContainer
  annotations: {}
  labels: {}
  portName: service

...
네임스페이스를 생성하고 helm으로 grafana를 설치해줍니다.
$ kubectl create namespace monitoring$ helm install grafana grafana/grafana -f values.yaml --namespace monitoring
NAME: grafana
LAST DEPLOYED: Fri Sep 17 17:16:09 2021
NAMESPACE: monitoring
STATUS: deployed
REVISION: 1
NOTES:
1. Get your 'admin' user password by running:
kubectl get secret --namespace monitoring grafana -o jsonpath="{.data.admin-password}" | base64 --decode ; echo
2. The Grafana server can be accessed via port 80 on the following DNS name from within your cluster:
grafana.monitoring.svc.cluster.local
Get the Grafana URL to visit by running these commands in the same shell:
export NODE_PORT=$(kubectl get --namespace monitoring -o jsonpath="{.spec.ports[0].nodePort}" services grafana)
export NODE_IP=$(kubectl get nodes --namespace monitoring -o jsonpath="{.items[0].status.addresses[0].address}")
echo http://$NODE_IP:$NODE_PORT
3. Login with the password from step 1 and the username: admin
#################################################################################
###### WARNING: Persistence is disabled!!! You will lose your data when #####
###### the Grafana pod is terminated. #####
#################################################################################
설치가 완료되면 pod과 service를 확인해줍니다.
$ kubectl get pods --namespace monitoring

NAME                                             READY   STATUS             RESTARTS   AGE
grafana-dd6cb8db9-dcwpn                          0/1     Running            0          29s
$ kubectl get services --namespace monitoring
NAME TYPE CLUSTER-IP EXTERNAL-IP PORT(S) AGE
grafana NodePort 10.101.234.8 <none> 80:31030/TCP 60s
2.2. Grafana Web UI 확인
설치가 완료되면 브라우저에 접속하여 그라파나를 확인해줍니다. grafana 서비스에 nodePort로 설정한 포트로 접속해줍니다.

values.yaml에서 설정한 admin 계정으로 로그인하면 다음과 같이 홈 화면이 나타납니다.

3. Grafana에 Prometheus 연동하기
3.1. Prometheus Data Source 추가하기
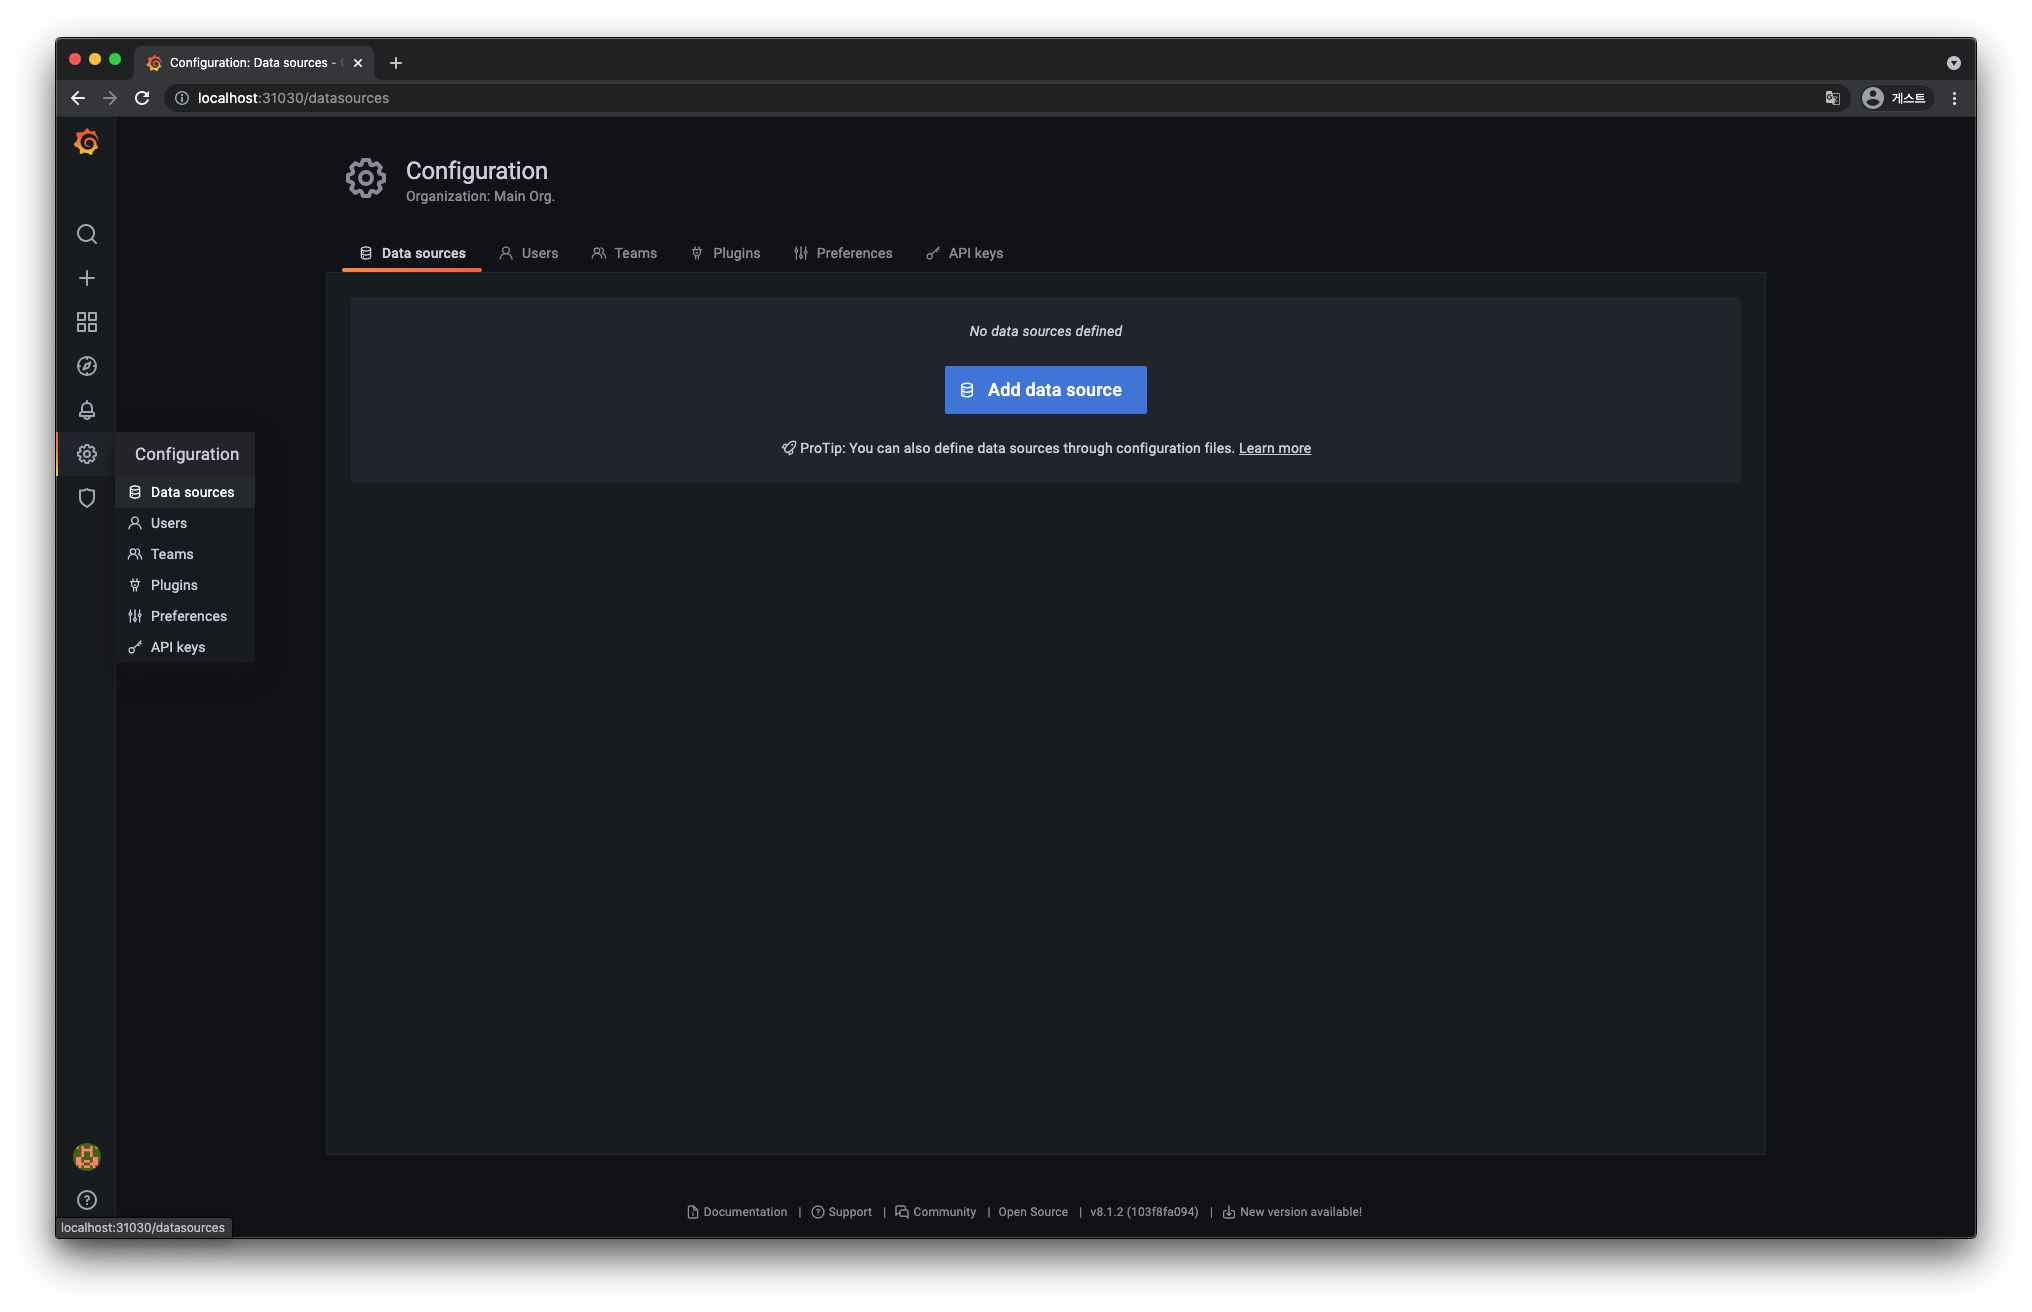
Grafana Web UI 좌측 메뉴에서 'Configuration' > 'Data sources' 메뉴를 클릭합니다. 화면이 나타나면 'Add data source' 버튼을 클릭합니다.
Time series databases에서 'Prometheus'를 선택합니다.

다음과 같이 연동할 프로메테우스에 대한 정보를 입력하고 'Save & test' 버튼을 클릭합니다. 정상적으로 연동되면 'Data source is working'이라는 메시지가 나타납니다.

만약 다음과 같이 "Bad Gateway"라는 메시지가 나타나면 values.yaml을 수정하고 재설치해줍니다.

prometheus.yml > scrape_configs > targets 하위에 설정된 url의 도메인을 localhost에서 ip로 변경해줍니다.
values.yaml

...

## Prometheus server ConfigMap entries
##
serverFiles:

  ...

  prometheus.yml:
    rule_files:
      - /etc/config/recording_rules.yml
      - /etc/config/alerting_rules.yml
    ## Below two files are DEPRECATED will be removed from this default values file
      - /etc/config/rules
      - /etc/config/alerts

    scrape_configs:
      - job_name: prometheus
        static_configs:
          - targets:
            #- localhost:9090
            - 127.0.0.1:9090

 ...
Grafana + Prometheus 설치
시스템 모니터링 시스템을 알아보게 되면서 nagio, cacti등을 알아보았는대 1) ELK + MetricBeat 2) Grafana + Prometheus 이 두가지의 그래픽이 마음에 들게 되어 테스트를 해보게 되었다. 1) ELK + MetricBeat..
cookingpython.tistory.com
3.2. 대시보드 생성하기
좌측 메뉴에서 'Create' > 'Import' 메뉴를 클릭합니다. 화면이 나타나면 Dashboard ID를 입력하고 'Load' 버튼을 클릭해줍니다. Grafana Labs에서 다양한 built-in 대시보드를 제공하는데 실습에는 Kubernetes Cluster의 ID를 사용했습니다.
Grafana Dashboards - discover and share dashboards for Grafana.
Grafana.com provides a central repository where the community can come together to discover and share dashboards.
grafana.com

다음과 같이 설정 화면이 나타나는데 Data source로 Prometheus를 선택하고 'Import' 버튼을 클릭해줍니다.

생성이 완료되면 다음과 같이 대시보드가 나타나는 것을 확인할 수 있습니다.

이상으로 Kubernetes 클러스터에 Grafana를 설치하고 Prometheus와 연동하는 방법에 대해 알아봤습니다.
※ Reference
- jerryljh.tistory.com, 15. Kube 교육 - Prometheus Stack 설치, https://jerryljh.tistory.com/9
- happycloud-lee.tistory.com, prometheus와 grafana를 이용한 통합모니터링 체계 구축, https://happycloud-lee.tistory.com/203
- ikcoo.tistory.com, 47. Kubernetes Monitoring : Grafana, https://ikcoo.tistory.com/108
- waspro.tistory.com, Helm Chart를 활용한 Prometheus & Grafana Kubernetes에 구성하기, https://waspro.tistory.com/588
- cookingpython.tistory.com, Grafana + Prometheus 설치, https://cookingpython.tistory.com/21